Navigate
Cocaine Facts
- The negative side effects of habitual cocaine use that was responsible for coining the phrase, "dope fiend".
- Street names: blow, 'caine, coke, cola, freeze, snow (powder), base, rock (crack), blizzard, sleet, white lady, nose candy, soda, snow cone, blanco, cubes.
- Up to 75% of people who try cocaine will become addicted to it. Only one out of four people who try to quit will be able to without help.
- Cocaine is one of the oldest known drugs. The pure chemical, cocaine hydrochloride, has been an abused substance for more than 100 years.
Cocaine Statistics
- The annual number of new cocaine users has generally increased over time. In 1975, there were 30,000 new users. The number increased from 300,000 in 1986 to 361,000 in 2000.
- The average age of cocaine initiates rose from 17.2 years in 1967 to 23.8 years in 1991 and subsequently declined to approximately 20 years from 1997 to 2000.
- Cocaine addiction was responsible for 14 % of the 1.6 million admissions in 1999 to publicly funded drug addiction facilities.
Cocaine Treatment Admission Statistics Decrease: 1993-1999
Admissions to publicly funded
substance abuse treatment facilities for cocaine abuse declined by 23 percent
between 1993 and 1999, from 136 to 104 per 100,000 persons aged 12 or older.
Cocaine was responsible for 14 percent of the 1.6 million admissions in 1999
to these facilities. Cocaine and opiates (at 15 percent) were the leading illicit
drugs responsible for treatment admissions.
Cocaine treatment admission rates were generally highest in the middle Atlantic
and some southern States. Trends indicated stable or declining admission rates
for primary cocaine abuse in most States.
For this report, cocaine treatment admission rates per 100,000 persons aged 12 or older were calculated for each State for 1993 to 1999 using the Treatment Episode Data Set (TEDS). Cocaine treatment admissions include both smoked cocaine (crack) and cocaine used by other routes of administration. Crack cocaine treatment admissions accounted for about three quarters of all cocaine treatment admissions annually from 1993 to 1999.
|
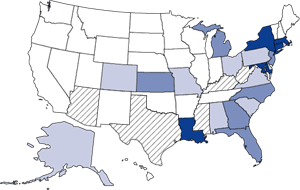
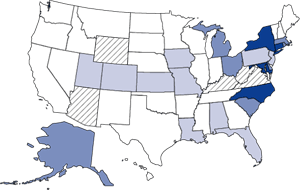
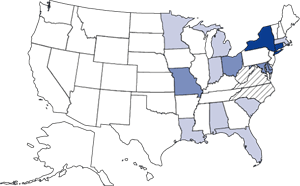
Figure 1. Cocaine Treatment Admission Rates per 100,000 Persons Aged 12 or Older: 1993, 1996, 1999* Admissions per 100,000 Aged 12 or Older
|
|||||||||||||||||||||||||||||||||||||||||||||||||||||||||||||||||||||||||||||||||||||
|
1993
 |
|||||||||||||||||||||||||||||||||||||||||||||||||||||||||||||||||||||||||||||||||||||
|
Cocaine Treatment Admission Rates: 1993 In 1993, the
treatment admission rate for primary cocaine abuse in the United States
was 136 admissions per 100,000 persons aged 12 or older. Five States had
rates of 207 or more per 100,000, while 53 percent of reporting States
had rates of less than 114 per 100,000. |
|||||||||||||||||||||||||||||||||||||||||||||||||||||||||||||||||||||||||||||||||||||
|
1996
 |
|||||||||||||||||||||||||||||||||||||||||||||||||||||||||||||||||||||||||||||||||||||
|
Cocaine Treatment Admission Rates: 1996 By 1996, the
treatment admission rate for primary cocaine abuse in the United States
had decreased by 10 percent, to 122 per 100,000 persons aged 12 or older.
Five States had rates over 207 per 100,000, while 25 States (54 percent
of reporting States) had rates of less than 114 per 100,000. |
|||||||||||||||||||||||||||||||||||||||||||||||||||||||||||||||||||||||||||||||||||||
|
1999
 |
|||||||||||||||||||||||||||||||||||||||||||||||||||||||||||||||||||||||||||||||||||||
|
Cocaine Treatment Admission Rates: 1999 By
1999, the treatment admission rate for primary cocaine abuse in the United
States as a whole had decreased to 104 per 100,000 persons aged 12 or
older. Two States had rates of 207 per 100,000 or more. Sixty-seven percent
of reporting States had rates of less than 114 per 100,000. |
|||||||||||||||||||||||||||||||||||||||||||||||||||||||||||||||||||||||||||||||||||||
|
Figure
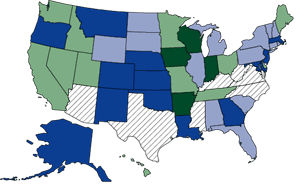
2. Changes in Cocaine Treatment Admission Rates: 1993-1999 |
|||||||||||||||||||||||||||||||||||||||||||||||||||||||||||||||||||||||||||||||||||||
 Percent
Change |
|||||||||||||||||||||||||||||||||||||||||||||||||||||||||||||||||||||||||||||||||||||
|
Changes in Cocaine Treatment Admission Rates: 1993-1999 Cocaine treatment admission rates decreased in 63 percent of reporting States between 1993 and 1999. Rates decreased over this period by 35 percent or more in 13 States, and by 10 to 34 percent in another 11 States. Some of the largest rate decreases were reported in States that had high rates in 1993, such as Louisiana, Maryland, and Massachusetts (Table 1). Increases in cocaine treatment rates were seen in some States, primarily in the Midwest. The largest increases were seen in Arkansas, Iowa, Wisconsin, and Indiana, ranging from 76 to 246 percent. |
|||||||||||||||||||||||||||||||||||||||||||||||||||||||||||||||||||||||||||||||||||||
|
|
|||||||||||||||||||||||||||||||||||||||||||||||||||||||||||||||||||||||||||||||||||||
|
Table 1. States with High Cocaine Treatment Admission Rates and Large Percentage Changes in Rates: 1993-1999 |
|||||||||||||||||||||||||||||||||||||||||||||||||||||||||||||||||||||||||||||||||||||
|
|||||||||||||||||||||||||||||||||||||||||||||||||||||||||||||||||||||||||||||||||||||
| Figure
Notes: *The map categories are based on the median, 75th, and 90th percentiles of the range of 1994 cocaine treatment admission rates. Dark blue indicates States with rates at or above the level of the 1994 90th percentile (i.e., 207 admissions per 100,000 population aged 12 or older); medium blue indicates rates from the 1994 75th to 89th percentiles; light blue indicates rates from the 1994 50th to 74th percentiles; and white indicates States with rates below the median 1994 admission rate (i.e., 114 admissions per 100,000 population aged 12 or older). Crosshatching indicates States for which data were incomplete or not submitted for a given year. |
|||||||||||||||||||||||||||||||||||||||||||||||||||||||||||||||||||||||||||||||||||||
|
The Drug and Alcohol Services Information System (DASIS) is an integrated data system maintained by the Office of Applied Studies, Substance Abuse and Mental Health Services Administration (SAMHSA). One component of DASIS is the Treatment Episode Data Set (TEDS), a national-level dataset comprising State administrative data from treatment facilities receiving public funds. The TEDS system includes records for some 1.6 million substance abuse treatment admissions annually. TEDS records represent admissions rather than individuals, as a person may be admitted to treatment more than once. The DASIS Report is prepared by the Office of Applied Studies, SAMHSA; Synectics for Management Decisions, Inc., Arlington, Virginia; and RTI, Research Triangle Park, North Carolina. Information and data for this issue are based on data reported to TEDS through April 16, 2001. Information provided by SAMHSA |
|||||||||||||||||||||||||||||||||||||||||||||||||||||||||||||||||||||||||||||||||||||

